# 这是什么
npoi 是开源的 C# 处理 Word、Excel 的库,无需使用数据库或 COM 组件,原理为 xml 处理
# 问题
npoi 自带的 Excel 的折线图绘制中有以下问题:
# NPOI 简易使用
# Excel
# 数据写入
- 首先创建一个 Sheet
1
2
| IWorkbook wb = new XSSFWorkbook();
ISheet sheet = wb.CreateSheet("Sheet1");
|
- 之后按照坐标的方式写入数据,此处展示一行一行写入的方法
1
2
3
4
5
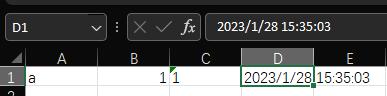
| IRow row = sheet.CreateRow(0);
row.CreateCell(0).SetCellValue("a");
row.CreateCell(1).SetCellValue(1);
row.CreateCell(2).SetCellValue("1");
row.CreateCell(3).SetCellValue(DateTime.Now.ToString("G"));
|
![file]()
由上图可见,单元格内容格式随填入 Value 的类型变化而变化,注意数字与文本的类型区别
- 保存表格
1
2
3
4
| using (FileStream fs = File.Create("test.xlsx"))
{
wb.Write(fs);
}
|
# 绘制折线图
- 创建图表对象
1
2
| IDrawing drawing = sheet.CreateDrawingPatriarch();
IClientAnchor anchor = drawing.CreateAnchor(0, 0, 0, 0, 0, 5, 10, 15);
|
anchor 为图表所在的位置以及图表的大小, CreateAnchor 中控制图表位置大小的参数在后 4 个参数,分别为左上角的坐标以及右下角的坐标,且左上角在设置的 row 之下但右上角在设置的 row 之上
![file]()
- 设置图表数据
1
2
3
4
5
6
7
8
9
10
11
12
13
14
15
16
| XSSFChart chart = (XSSFChart)drawing.CreateChart(anchor);
chart.SetTitle("Test 1");
IChartLegend legend = chart.GetOrCreateLegend();
legend.Position = LegendPosition.TopRight;
ILineChartData<double, double> data = chart.ChartDataFactory.CreateLineChartData<double, double>();
IChartAxis bottomAxis = chart.ChartAxisFactory.CreateCategoryAxis(AxisPosition.Bottom);
IValueAxis leftAxis = chart.ChartAxisFactory.CreateValueAxis(AxisPosition.Left);
leftAxis.Crosses = AxisCrosses.AutoZero;
IChartDataSource<double> xs = DataSources.FromNumericCellRange(sheet, new CellRangeAddress(0, 0, 0, NUM_OF_COLUMNS - 1));
IChartDataSource<double> ys1 = DataSources.FromNumericCellRange(sheet, new CellRangeAddress(1, 1, 0, NUM_OF_COLUMNS - 1));
IChartDataSource<double> ys2 = DataSources.FromNumericCellRange(sheet, new CellRangeAddress(2, 2, 0, NUM_OF_COLUMNS - 1));
var s1 = data.AddSeries(xs, ys1);
s1.SetTitle("Series 1");
var s2 = data.AddSeries(xs, ys2);
s2.SetTitle("Series 2");
chart.Plot(data, bottomAxis, leftAxis);
|
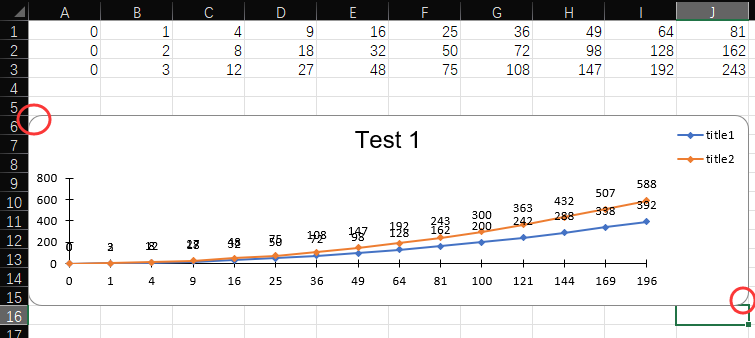
上述代码中,创建了两个系列,且将表格的第一行作为 X 轴,系列 1 将第二行作为 Y 值,系列 2 将第三行作为 Y 值,一一对应映射出整个图表。结果如上图所示
- 手动添加表格点
1
2
3
4
5
6
| double[] arr = new double[] { 1, 2, 3, 4 };
double[] arr2 = new double[] { 8, 7, 6, 5 };
IChartDataSource<double> xs = DataSources.FromArray(arr);
IChartDataSource<double> ys = DataSources.FromArray(arr2);
var s1 = data.AddSeries(xs, ys);
s1.SetTitle("Series 1");
|
值也可使用 DateTime 类型
# 设置非平滑折线图
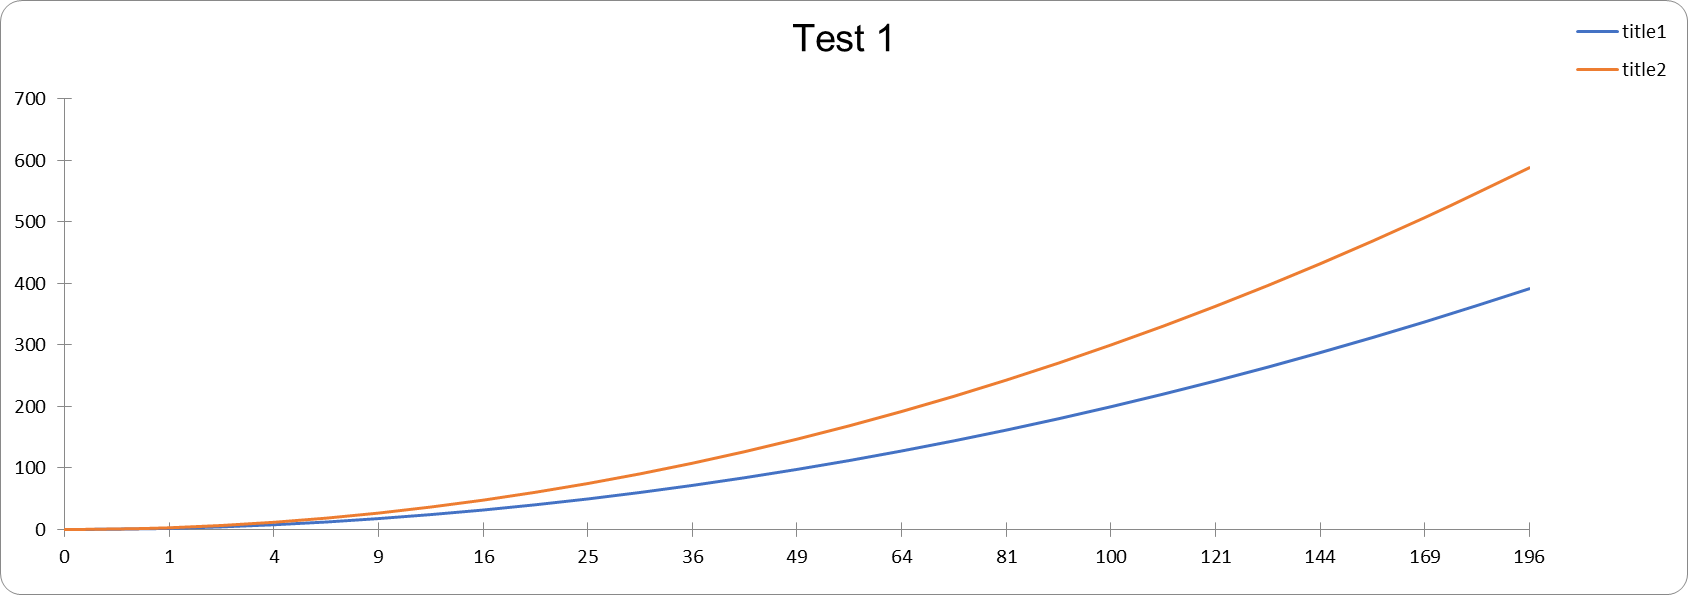
经过上述的代码,可创建出一个折线图,但是为平滑处理后的,不符合预想,且无法在数据点上显示具体数字。
查询过各种资料之后,了解到目前 NPOI 未提供修改这些参数的方法。但是偶然间发现了一篇使用 NPOI 绘制饼状图的文章,由于 NPOI 也未提供饼状图的绘制方法,所以就仔细查看了一下。
https://stackoverflow.com/a/66534351
其中调用了 CT_Chart.plotArea ,修改了更底层未暴露的参数来实现了效果,现版本的 NPOI 提供了方法暴露 CT_Chart ,不需要再使用反射的方法获取。
1
2
3
4
5
6
7
8
9
10
11
12
13
14
15
| var plotArea = chart.GetCTChart().plotArea;
foreach (var item in plotArea.lineChart[0].ser)
{
item.AddNewMarker().AddNewSymbol().val = ST_MarkerStyle.diamond;
item.smooth = new CT_Boolean() { val = 0 };
item.dLbls = new CT_DLbls
{
showVal = new CT_Boolean { val = 1 },
showSerName = new CT_Boolean { val = 0 },
showCatName = new CT_Boolean { val = 0 },
showLegendKey = new CT_Boolean { val = 0 },
showLeaderLines = new CT_Boolean { val = 0 },
dLblPos = new CT_DLblPos { val = ST_DLblPos.t }
};
}
|
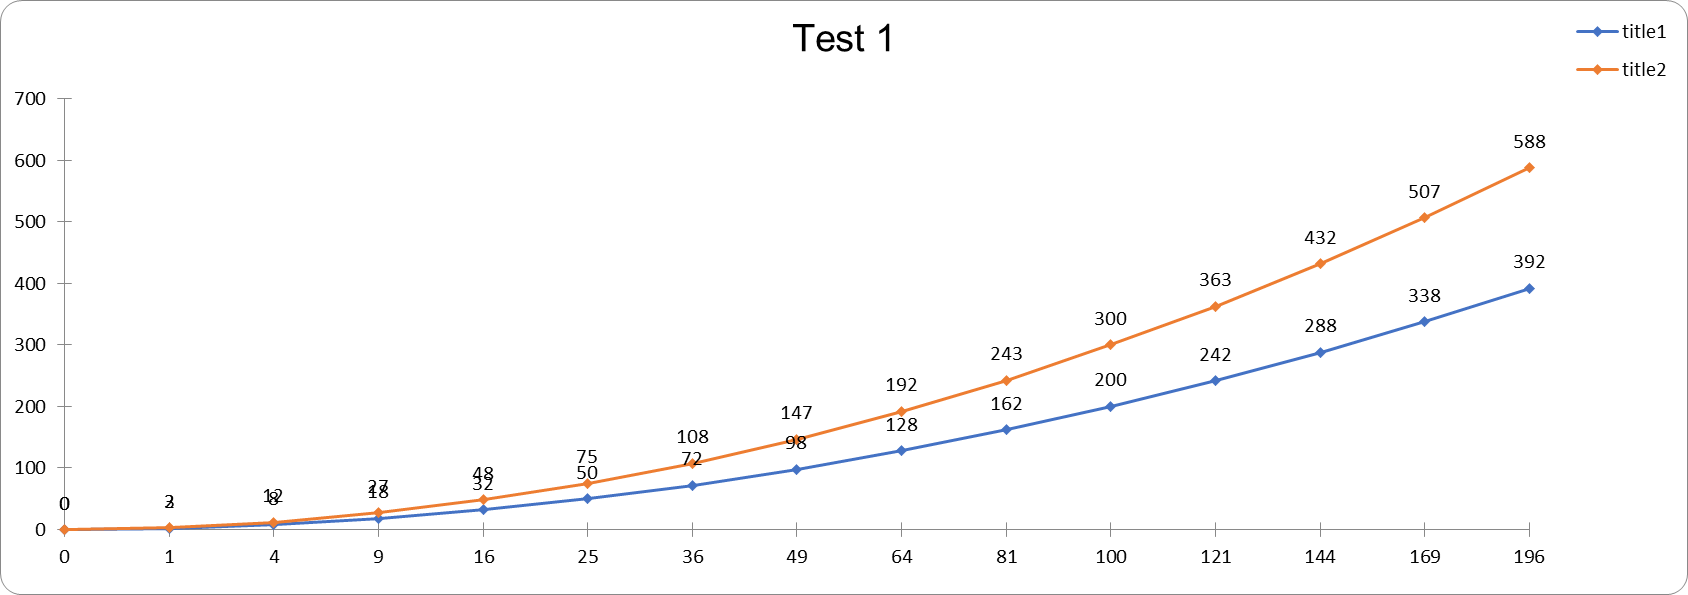
![file]()
非平滑、添加数据点
![file]()
平滑